| Cuyahoga County Population Growth + | |||||||||||
| Year | Population | Rate of Change | Real Population Growth | ||||||||
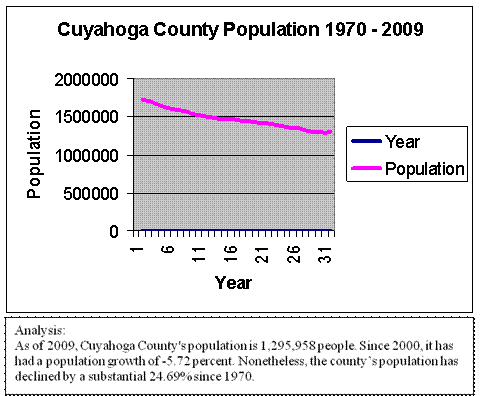
| 1970 | 1,720,835 | ||||||||||
| 1971 | 1,707,600 | -0.77 | -0.77 | ||||||||
| 1972 | 1,670,000 | -2.20 | -1.43 | ||||||||
| 1973 | 1,643,700 | -1.57 | 0.63 | ||||||||
| 1974 | 1,617,100 | -1.62 | -0.04 | ||||||||
| 1975 | 1,595,200 | -1.35 | 0.26 | ||||||||
| 1976 | 1,578,100 | -1.07 | 0.28 | ||||||||
| 1977 | 1,559,100 | -1.20 | -0.13 | ||||||||
| 1978 | 1,538,700 | -1.31 | -0.10 | ||||||||
| 1979 | 1,514,200 | -1.59 | -0.28 | ||||||||
| 1980 | 1,498,400 | -1.04 | 0.55 | ||||||||
| 1981 | 1,485,870 | -0.84 | 0.21 | ||||||||
| 1982 | 1,474,693 | -0.75 | 0.08 | ||||||||
| 1983 | 1,472,065 | -0.18 | 0.57 | ||||||||
| 1984 | 1,466,936 | -0.35 | -0.17 | ||||||||
| 1985 | 1,458,564 | -0.57 | -0.22 | ||||||||
| 1986 | 1,448,590 | -0.68 | -0.11 | ||||||||
| 1987 | 1,438,907 | -0.67 | 0.02 | ||||||||
| 1988 | 1,421,546 | -1.21 | -0.54 | ||||||||
| 1989 | 1,417,480 | -0.29 | 0.92 | ||||||||
| 1990 | 1,412,140 | -0.38 | -0.09 | ||||||||
| 2000 | 1,393,978 | -1.29 | -0.91 | ||||||||
| 2001 | 1,381,701 | -0.88 | 0.41 | ||||||||
| 2002 | 1,369,638 | -0.87 | 0.01 | ||||||||
| 2003 | 1,356,396 | -0.97 | -0.09 | ||||||||
| 2004 | 1,342,569 | -1.02 | -0.05 | ||||||||
| 2005 | 1,325,424 | -1.28 | -0.26 | ||||||||
| 2006 | 1,307,936 | -1.32 | -0.04 | ||||||||
| 2007 | 1,295,187 | -0.97 | 0.34 | ||||||||
| 2008 | 1,283,925 | -0.87 | 0.11 | ||||||||
| 2009 | 1,295,958 | 0.94 | 1.81 | ||||||||
| Overall Growth + | -24.69 | ||||||||||
| Methodology: | |||||||||||
| Rate of Change = ((population year - previous year)/population year * 100) | |||||||||||
| Real Population Growth = population year - previous year | |||||||||||
| Overall Growht = ((2009 population - 1970 population) / 1970 poupulation * 100 | |||||||||||
|
|
|||||||||||